Table 3. Angiogenic gene expression significantly altered in ECs of kidney of diabetic animals. * Values indicated are fold change relative to healthy controls. Values in green are the downregulated genes (p value < 0.05)
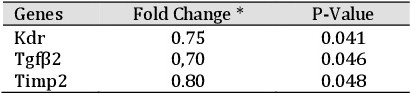
Table 3. Angiogenic gene expression significantly altered in ECs of kidney of diabetic animals. * Values indicated are fold change relative to healthy controls. Values in green are the downregulated genes (p value < 0.05)